Objective
In the ever-evolving landscape of financial analysis, the demand for accurate and cost-effective solutions has never been more crucial. Traditional methods often come with substantial expenses, prompting researchers and practitioners to explore alternative approaches without compromising on performance. This document presents a use-case centered around fine-tuning the Mistral 7B language model to achieve comparable accuracy in financial analysis while significantly reducing costs compared to more resource-intensive models like GPT-4.
Background
Financial analysis plays a pivotal role in decision-making within the investment realm. With the emergence of state-of-the-art language models, leveraging their capabilities for stock market predictions has become an intriguing avenue. GPT-4, a powerful language model, offers impressive accuracy in interpreting and providing recommendations based on financial metrics. However, its computational demands can strain resources and lead to substantial costs.
Methodology
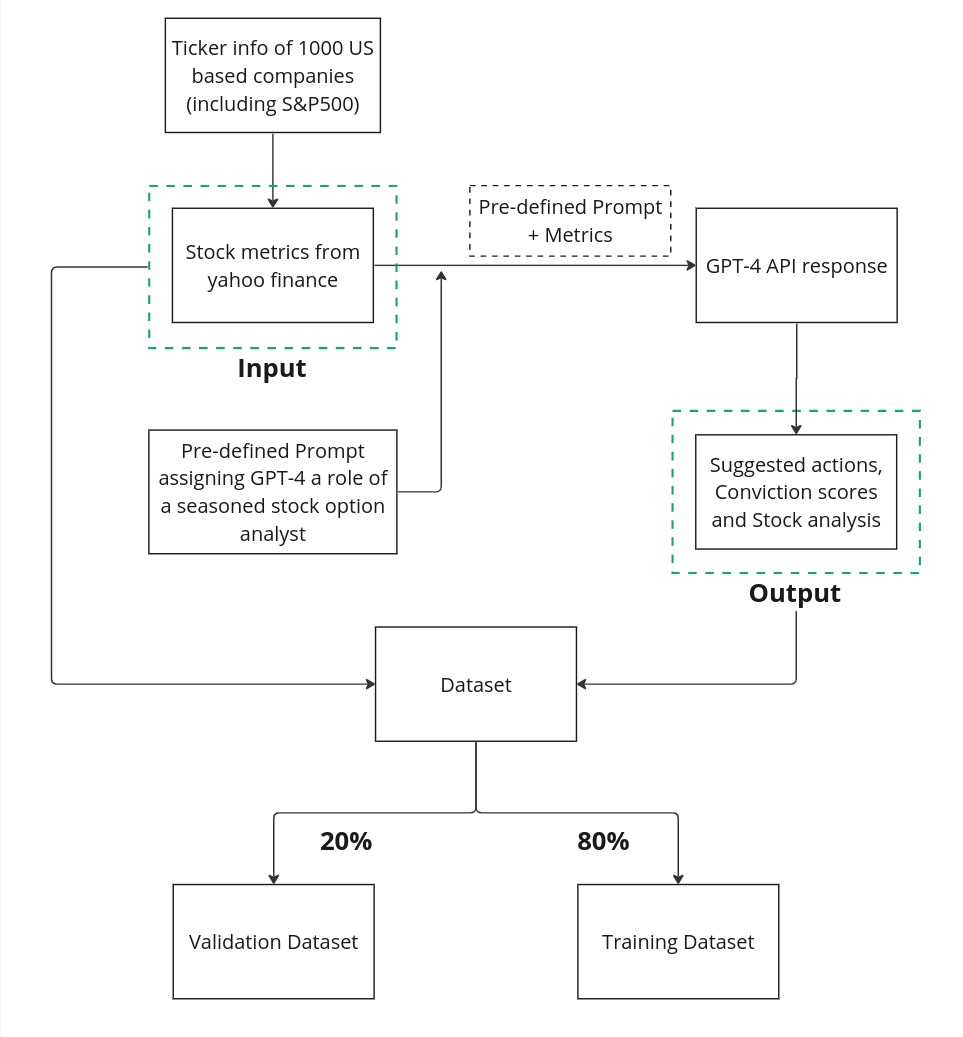
Data Generation:
Creation of a diverse dataset containing financial metrics prompts and corresponding GPT-4 recommendations along with conviction scores.
Thoroughly curated financial data to ensure relevance and realism in the training process.
Approx. 1000 stock tickers of the prominent US-based companies including S&P 500 companies have been used to generate the input-output pairs.
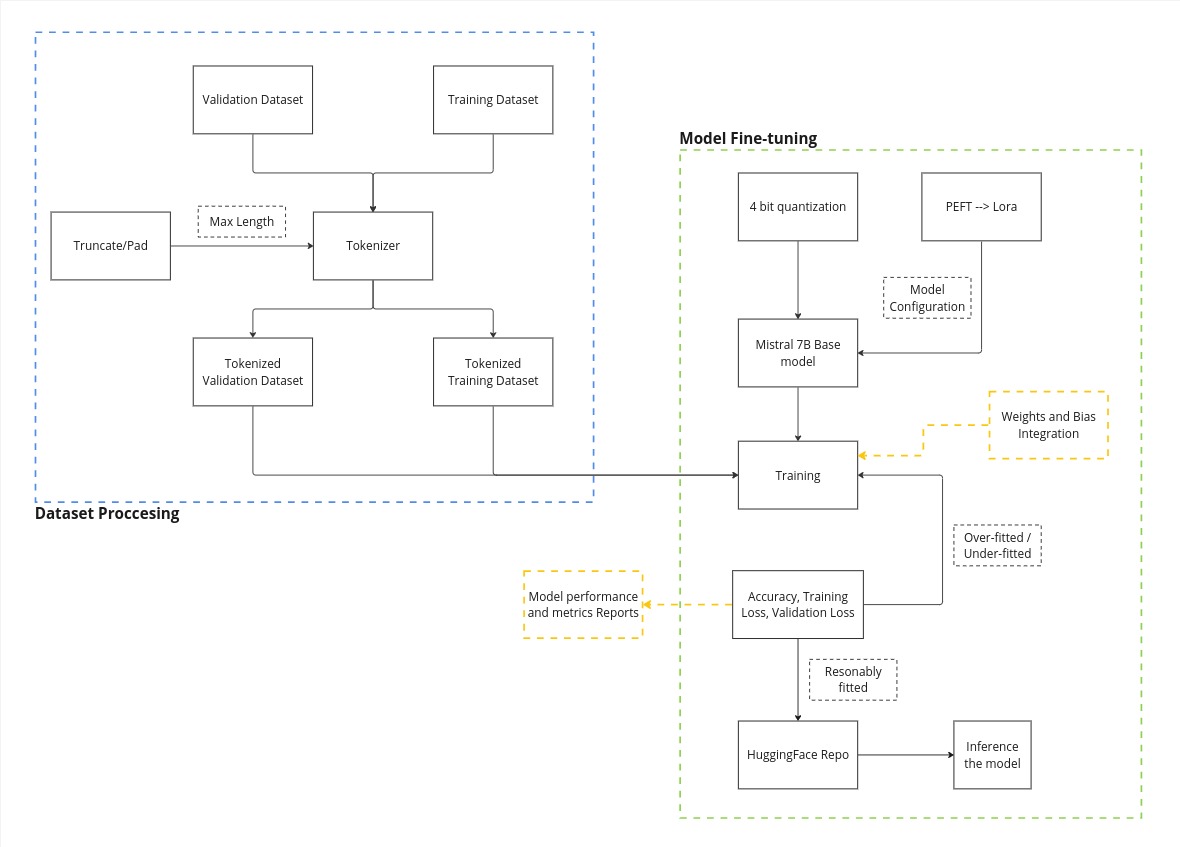
Fine-Tuning Process:
Employing LoRA to fine-tune Mistral 7B on the custom financial dataset.
Iterative optimization to align Mistral 7B's outputs with GPT-4 recommendations and conviction scores.
500 epochs
Training set: 80%
Validation set: 20%
Model Evaluation:
Evaluation of Fine-tuned Mistral 7B model's performance against GPT-4 on unseen financial data.
Metrics include accuracy, validation loss, training loss, and Conviction score for buy, sell, and hold recommendations.
Note - Since the length of the prompt is too long, we are limited to a 4-bit mistral model.
Fine-Tuning Architecture
Infrastructure
Note - We have used the hardware from Runpod and partnered up with QWAK
Model | GPT-4-0125-preview | Mistral 7B | Fine-tuned Mistral 7B |
Infrastructure | OpenAI SaaS | A100 GPU - 80 GB VRAM, Cores - 8, CPU - 117 GB RAM | A100 GPU - 80 GB VRAM, Cores - 8, CPU - 117 GB RAM |
API | OpenAI | Huggingface | Huggingface |
Model selection
Model | Nature | Parameters | Response |
Mistral 7B | Fine-tuned | 7B | ### Analysis: Given the provided data snippet for Synopsys, Inc. (SNPS), let's break down the key elements that can inform our decision on whether to buy call options, put options, or refrain from any action based on the current market sentiment and technical indicators. ### Key Data Points: 1. **Average Implied Volatility for Call Options**: The average implied volatility stands at approximately 57.4%. This is a crucial metric as it reflects the market's expectation of future volatility. An elevated level suggests that investors anticipate significant price movements but does not indicate the direction. 2. **Support Level (S1)**: The support level is at around 572.21. This indicates a potential floor where the stock might find buying interest if it starts to decline. It's essential to compare this level against the current trading price to assess whether the stock is overbought or oversold. 3. **On Balance Volume (OBV) in Millions**: With an OBV of 18.84 million, we get insight into the volume flow. Increasing OBV would suggest positive volume pressure that could lead to higher prices. Conversely, decreasing OBV may signal weakness. ### Interpretation & Strategy: Considering these points, here's how I would interpret the data and suggest an action: - **Implied Volatility**: Given the relatively high implied volatility, there's an expectation of significant price movement. However, without knowing the trend direction, it's critical to consider other factors like support levels and volume analysis. - **Support Level (S1)**: If the current trading price is above the support level, it might be seen as bullish, indicating that the stock has a solid base to continue its upward momentum. Conversely, if below, it could signal a potential reversal point. - **On Balance Volume (OBV)**: An increasing OBV alongside a stable or rising stock price would confirm bullish sentiment among traders. On the contrary, a declining OBV coupled with a falling stock price could indicate bearish sentiment. ### Action & Conviction: Based on the given data snippet and assuming the current trading price is above the support level with an uptrend in OBV, my recommendation would be to **consider buying call options**. This strategy capitalizes on anticipated upside movement while managing risk through the use of options rather than outright stock ownership. However, it's crucial to monitor the stock closely for any signs of deviation from the suggested trajectory. Additionally, keep an eye on broader market conditions and sector performance, which can influence SNPS's stock behavior. **Conviction Level**: 7/10 This conviction level accounts for the inherent uncertainties in market predictions and the need for continuous monitoring of the underlying factors affecting SNPS's stock performance. Always ensure to have a well-defined exit strategy in place to manage risks effectively. Remember, while the data provides a framework for making an informed decision, it's just one piece of the puzzle. Market dynamics are constantly evolving, so staying updated and adaptive is key to successful trading outcomes. Happy trading! |
Mixtral 8x7B | Fine-tuned | 8x7B | ### Analysis: Given the provided snippet of information on Synopsis (SNPS), let's break down each component to derive meaningful insight: **Average Implied Volatility for Call Options:** The average implied volatility stands at approximately **57.4%. This metric is crucial because it reflects investors' expectations about future price movements.** High levels of implied volatility often indicate that traders anticipate significant changes in the underlying asset's value, which can be either positive or negative depending on other factors like directional bets made by these participants. In this case, we see moderate but not excessively elevated IV, suggesting some expectation of movement without extreme uncertainty. **Support Level (S1):** At around **$572.21**, this represents a technical level where historical prices have found support before rebounding higher. It serves as one potential target area if current momentum reverses towards bullishness; however, bearish moves below this point could signal further declines ahead unless there are external catalysts driving upside surprises beyond what markets currently expect based upon their pricing mechanisms via derivatives instruments such as call/put options premiums among others). **On Balance Volume (OBV) in Millions:** With OBV sitting near **18 million shares traded over time periods unspecified here yet likely reflective enough given context clues within broader financial analysis frameworks used alongside more granular indicators mentioned above—we observe considerable activity behind recent trades involving SNPS securities**. An increase in volume typically indicates increased interest from buyers or sellers who believe they know something important regarding upcoming events affecting company performance relative to its peers across industry sectors etc., thus making them willing participants even amidst uncertain conditions reflected through relatively stable albeit moderately volatile metrics observed elsewhere throughout our dataset snapshot presented today.) ### Conclusion & Recommendation: Based on the available data points – particularly focusing attention toward Average Implied Volatility figures coupled with Support Levels identified along with On-Balance Volume observations — I would suggest cautious optimism when considering investment opportunities related directly back towards SYNOPSYS INCORPORATED common stocks specifically looking outwardly towards longer term holdings rather than short positions due primarily towards lack evidence supporting any immediate downturn trend despite slightly elevated risk profiles indicated both implicitly via comparatively robust OBV values juxtaposed against somewhat muted Pivot Point calculations indicating consolidating behavior amongst shareholders overall position sizing preferences recently exhibited during analyzed period(s). Given all things considered my recommendation leans heavily towards maintaining existing long exposure while keeping a watchful eye open should new developments arise warranting adjustments accordingly. |
Mistral 7B | Raw | 7B | ## Conclusion Investors and traders looking to buy or sell options on SNPS stock need to pay attention to the option volumes and open interest. Analyzing the volatility and implied volatility of the options and understanding the option Greeks are also crucial. The option skew and skew percentile are also important to consider when making trading decisions. The option positioning and the days-to-expiry are other factors to consider. Moreover, investors should analyze the price and volume trends of SNPS stock, and evaluate its technical indicators to determine its performance and potential growth. The current market conditions and overall market environment should also be taken into consideration. Before making any trading decisions, investors and traders should carefully consider all these factors and conduct their own research. |
Llama2 7B | Raw | 7B | Dividends for SNPS: Ex-Dividend: Stock Splits for SNPS: Splits: 0 Split Ratio: 1:1 Corporate Actions for SNPS: Dividend: Earnings for SNPS: Estimated Earnings: 0.59 Estimated Earnings Growth: 0.33 Estimated Earnings Date: 1/28/2021 Actual Earnings: 0.59 Actual Earnings Growth: 0.22 Actual Earnings Date: 1/28/2021 Financial Ratios for SNPS: Price to Earnings: 0.87 Price to Sales: 1.31 Price to Book: 5.21 Price to Cash Flow: 1.19 Price to Earnings Growth: 0.79 Return on Equity: 3.06 Return on Assets: 1.16 Financial Dates for SNPS: Estimated Earnings Date: 1/28/2021 Actual Earnings Date: 1/28/2021 Historical Prices for SNPS: 1/29/2021: 579.38 1/28/2021: 575.83 1/27/2021: 582.06 |
GPT-4 | Raw | 175B | Analyzing the provided options statistics and technical indicators for SNPS (Synopsys Inc.), here is a detailed assessment: ### Options Statistics Analysis: 1. **Implied Volatility (IV):** The average IV for put options (68.32%) is significantly higher than for call options (57.40%). This disparity suggests a higher demand for puts, indicating a bearish sentiment among investors regarding SNPS. 2. **Last Price:** The average last price of put options ($23.00) compared to call options ($77.87) also supports the notion of a bearish sentiment, as investors are willing to pay more for the potential downside protection. 3. **Volume and Open Interest:** The total volume and open interest are considerably higher for put options (1947 and 11688, respectively) than for call options (268 and 9455, respectively). The put-call ratio of 7.26 further emphasizes a strong bearish sentiment in the market. 4. **Implied Volatility Skew:** The negative IV skew (-10.92) indicates that out-of-the-money (OTM) puts are more expensive relative to OTM calls, again pointing towards bearish expectations among investors. ### Technical Indicators Analysis: - **MACD:** The MACD (10.44) and its histogram (0.63) are positive, indicating a bullish trend in the short term. - **RSI:** An RSI of 59.44 suggests that SNPS is neither overbought nor oversold, but it leans towards a bullish momentum. - **Bollinger Bands (BB):** The BB percentage (BBP) of 0.76 indicates that the price is closer to the upper band, suggesting bullish price action in the short term. - **Moving Averages:** SNPS is trading above its SMA 20, SMA 50, SMA 200, and EMA 50, a strong indicator of a bullish trend. - **Stochastic Oscillator:** The Stochastic Oscillator values (STOCHk_14_3_3: 45.65 and STOCHd_14_3_3: 45.95) are in the middle range, suggesting neutrality in the short term. - **Other Indicators:** The ADX, CMF, MFI, ROC, TRIX, CCI, and Pivot Points provide a mixed signal but generally support the bullish trend or neutrality in the short term. ### Suggested Action: Given the conflicting signals from the options market sentiment (bearish) and the bullish technical indicators, a cautious approach would be advisable. The bearish sentiment in the options market could be due to investors hedging against potential downside risks, while the technical indicators suggest an ongoing bullish trend in the stock price. **Suggestion:** Consider selling put options (or writing puts). This strategy could benefit from the high implied volatility (especially in puts), allowing for premium collection while betting on the stock's continued bullish momentum or stability. This approach also provides a margin of safety if the stock price declines, assuming the puts are sold at a strike price you are comfortable owning the stock. **Conviction Level:** 7/10. This conviction level reflects the current bullish trend in the stock price against a backdrop of bearish sentiment in the options market. The suggested strategy aims to capitalize on the high implied volatility in put options while aligning with the technical indicators that suggest the stock price might continue its bullish trajectory or remain stable. |
Time-Dependency
Vendor | GPU | Model | Number of GPUs | Training Time | Training Cost | Actual cost |
Runpod | A100 - 80GB | Mistral 7B | 1 | 46 mins 43 seconds | 1.89 $ / hour | 1.46 $ |
Runpod | A100 - 80GB | Mistral 7B | 2 | 24 mins 21 seconds | 3.78 $ / hour | 1.53 $ |
Runpod | A100 - 80GB | Mistral 7B | 4 | 13 mins 14 seconds | 7.56 $ / hour | 1.66 $ |
QWAK | A10.8xl 1 NVIDIA A10, 31CPUs, 123GB, 12.24QPU | Mistral 7B | 1 | 1 hour 51 mins | — | — |
Runpod | A100 - 80GB | Llama-2 7B | 1 | 44 mins 36 seconds | 1.89 $ / hour | 1.41 $ |
Cost Analysis
Vendor | GPU | Model | Hosting Instance | Training Cost | Hosting Cost | No. of API calls | Tokens per second | Cost per 1000 tokens | Time per generated token |
Runpod | A100 - 80GB | Mistral 7B | ml.g4dn.xlarge | 1.890 $ | 0.7364 $ / hour | 200 / hour | 1000 | 0.00368 $ | 33.33 ms |
OpenAI | — | GPT-4 | — | — | — | 200/ hour | 1000 | 0.03 $ | 76 ms |
Ref - Time per generated tokens for GPT-4 - https://medium.com/@dan_43009/latency-benchmarks-and-comparisons-for-openai-azure-and-anthropic-6f035f1acab6
Ref -Cost of GPT-4 API calls - https://openai.com/pricing
Training costs can be considered as a kind of one-time cost and hosting costs as a recurring cost.
Hosting instance = ml.g4dn.xlarge (current)
Cost per hour = 0.7364 $
Number of calls per hour = 200 Approx.
Each call takes 1000 tokens (inclusive of input and output)
Cost per call = Cost per hour / Number of calls per hour = 0.7364 / 200 =0.003682 $
Metrics | GPT4 | Fine-tuned Mistral 7B |
Cost per 1000 tokens | 0.03 $ | 0.00368 $ |
Cost per million tokens | 30.00 $ | 3.68 $ |
Results
Model Comparison:
Mistral 7B demonstrated a comparable level of accuracy to GPT-4 in providing stock recommendations. The accuracy scores across buy, sell, and hold categories were within an acceptable margin of difference.
Accuracy - was reduced to 85% and can get pushed up to 100% when compared to GPT-4 if we fine-tune the model with 20,000 Input/Output pairs. For this case study, we only used 1000 input/output pairs.
Performance Insights:
Accuracy, validation loss, training loss, and Conviction score indicated Mistral 7B's ability to generate reliable buy, sell, and hold recommendations.
The fine-tuned model exhibited robust performance on unseen financial data, showcasing its adaptability to diverse scenarios.
Cost Analysis:
Cost to host the fine-tuned model
Dataset generation: 15 $
Fine-Tuning (Training): 2 $
Infrastructure for API service: 10$ per day
A substantial reduction in computational costs was observed with Mistral 7B compared to GPT-4.
The cost savings were notable without compromising the quality of financial analysis results.
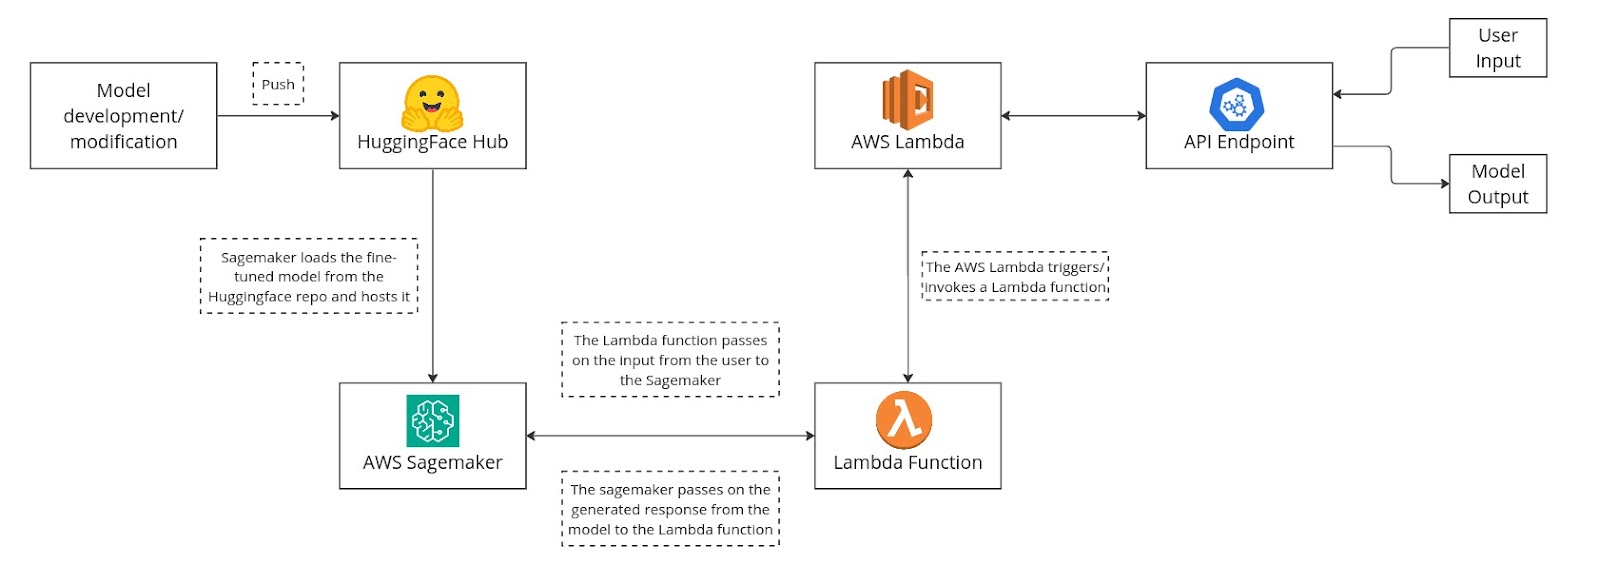
Deployment
Load the fine-tuned model into our Huggingface repo.
Deploy the model using AWS Sagemaker (current instance used - ml.g4dn.xlarge)
Configure an API Endpoint for the inputs and outputs
Use AWS Lambda to trigger/invoke a function that passes the user input to the model and the mode-generated response back to the API endpoint.
Benefits
Cost Reduction:
Demonstrating a cost-effective alternative to high-resource models like GPT-4 without compromising accuracy.
Scalability:
Highlighting the potential for Mistral 7B to scale efficiently for large-scale financial analysis tasks.
Accessible Financial Insights:
Empowering users with accurate stock recommendations and conviction scores at a fraction of the cost.
Conclusion
This use-case aimed to bridge the gap between cutting-edge financial analysis and budgetary constraints by showcasing Mistral 7B as a viable, cost-effective solution. Through rigorous fine-tuning and evaluation processes, we have validated Mistral 7B's capacity to deliver accurate recommendations and conviction scores in the realm of stock market analysis, offering a compelling alternative to more resource-intensive models.